Every block a plant can be built from — 22 of them — with what it takes in, what it makes, and the figures the canvas actually simulates on, read straight out of the india-2026 v0.1.0 packs. Open a card for its full table, its dials, and where each number came from.
3 of 197 figures are published and cited; the rest are defensible projections and say so beside the number. Unit rates are apportionments of published Indian project costs, never quoted equipment prices. No verified suppliers are listed yet — vendors, capacities and lead times will appear on a card as they are confirmed, kept apart from the modelled figures and labelled whenever a link is paid. Supply this equipment?
22 / 22
Feedstock
What arrives at the gate. These figures are intrinsic to the material — the plant cannot change them, it can only choose between them.
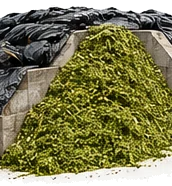
Napier silage
napier_silage
Dedicatedyear-roundassumed
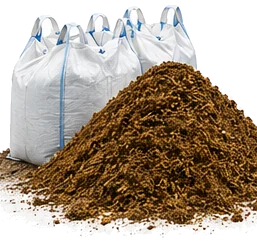
Dedicated elephant grass silage. Balanced C:N and reliable BMP.
Dedicated elephant grass silage grown year round on contracted acreage.
WHAT IT IS MADE OF
Total solids25%
needs a citation Cite Indian napier BMP study (IARI / TERI range 260-320 Nm3/t-VS)
Volatile solids, of total solids90%
needs a citation Cite Indian napier BMP study (IARI / TERI range 260-320 Nm3/t-VS)
C:N ratio25 : 1
needs a citation Cite Indian napier BMP study (IARI / TERI range 260-320 Nm3/t-VS)
WHAT IT TURNS INTO
Methane potential (BMP)280 Nm³/t VS
needs a citation Cite Indian napier BMP study (IARI / TERI range 260-320 Nm3/t-VS)
Methane fraction of raw biogas55%
needs a citation Cite Indian napier BMP study (IARI / TERI range 260-320 Nm3/t-VS)
Hydrolysis rate constant0.1 /day0.05 – 0.18
projection Ensiled energy grass. Lignocellulosic, but ensiling partly pre-hydrolyses the feed, so it sits above untreated straw and below mixed organics. Supersede with a measured value from the Kalaburagi trial the moment BMP-by-cut-age exists. Literature range for this substrate class. First-order hydrolysis constants for anaerobic digestion are conventionally reported in the 0.02-0.7 /d band, clustering by class: soluble sugars fastest, untreated lignocellulose slowest, manures and mixed organics between. Reviews of particulate hydrolysis kinetics (Vavilin and co-workers) and the ADM1 model report (Batstone and co-workers, IWA STR 13) are the basis for the bands.
PER FRESH TONNE
Volatile solids per fresh tonne225 kg
derived Total solids × volatile fraction. The plant is sized off this, not off the tonnage on the weighbridge.
Ultimate methane per fresh tonne63 Nm³ CH₄
derived BMP at infinite retention. A real reactor reaches a fraction of it, set by the hydrolysis constant above and the retention time of the digester it feeds.
WHAT IT COSTS
Reference delivered price₹1,500/t1,150 – 2,200
derived SBPL FDPR Kalaburagi (Jul 2026), FDPR-02: ₹1,150/t survey opportunity cost for contracted napier; upper band keeps the prior ₹2,200 national reference for non-captive supply
Palette default throughput3 t/day
assumed Palette default only. Never a modelling input once the author sets tonnage.
CARBON
Upstream carbon intensity4 gCO₂e/MJ
derived Ported from the config engine's four feedstock buckets. Replaced by per-feedstock sourced figures at stage 6.
Soil carbon credit-5 gCO₂e/MJ
projection Soil carbon under a perennial energy crop.
WHAT IT ADDS TO CAPEX
Unit rate, per tonnes a day delivered1,50,000
projection Reception, weighbridge, storage pad and bunker on delivered tonnage. Apportionment of published project costs, not a quoted price — never present as one.
Reference duty the rate applies at100
derived Reference duty at which the unit rate applies. Moving it without moving the rate re-prices every plant size.
Scale exponent0.97
projection Six-tenths-rule capacity factor: unit cost moves as (duty/ref)^(exponent-1). Held in the 0.88-0.97 band because Indian CBG equipment is modular rather than refinery-scale, and because the three sourced anchors themselves show only mild scale economy. A structural claim about how cost behaves, not a measured quantity.
DIALS ON THE CANVAS
Throughput3 t/dayrange 0.5 – 2,000Fresh tonnes delivered to the plant each day
Delivered price1,500 ₹/trange 0 – 3,750Catalogue reference is ₹1,500/t delivered. Gate price moves with belt, season and haulage.
Sugar mill pressmud
pressmud
Industrialseasonalassumed
Filter cake from sugar mill juice clarification. Dense, wet, cheap.
Sugar mill filter cake aggregated during the cane crushing season.
WHAT IT IS MADE OF
Total solids30%
needs a citation Cite ISMA / NSI pressmud characterisation
Volatile solids, of total solids75%
needs a citation Cite ISMA / NSI pressmud characterisation
C:N ratio22 : 1
needs a citation Cite ISMA / NSI pressmud characterisation
WHAT IT TURNS INTO
Methane potential (BMP)260 Nm³/t VS
needs a citation Cite ISMA / NSI pressmud characterisation
Methane fraction of raw biogas58%
needs a citation Cite ISMA / NSI pressmud characterisation
Hydrolysis rate constant0.12 /day0.06 – 0.2
projection Sugar-mill filter cake. Already partly degraded by the milling process, but waxy, which slows the accessible fraction. Literature range for this substrate class. First-order hydrolysis constants for anaerobic digestion are conventionally reported in the 0.02-0.7 /d band, clustering by class: soluble sugars fastest, untreated lignocellulose slowest, manures and mixed organics between. Reviews of particulate hydrolysis kinetics (Vavilin and co-workers) and the ADM1 model report (Batstone and co-workers, IWA STR 13) are the basis for the bands.
PER FRESH TONNE
Volatile solids per fresh tonne225 kg
derived Total solids × volatile fraction. The plant is sized off this, not off the tonnage on the weighbridge.
Ultimate methane per fresh tonne58.5 Nm³ CH₄
derived BMP at infinite retention. A real reactor reaches a fraction of it, set by the hydrolysis constant above and the retention time of the digester it feeds.
WHAT IT COSTS
Reference delivered price₹700/t
projection National reference, not a quote. Delivered price is a per-project number and the node dial overrides it.
Palette default throughput4 t/day
assumed Palette default only. Never a modelling input once the author sets tonnage.
CARBON
Upstream carbon intensity1 gCO₂e/MJ
derived Ported from the config engine's four feedstock buckets. Replaced by per-feedstock sourced figures at stage 6.
WHAT IT ADDS TO CAPEX
Unit rate, per tonnes a day delivered1,50,000
projection Reception, weighbridge, storage pad and bunker on delivered tonnage. Apportionment of published project costs, not a quoted price — never present as one.
Reference duty the rate applies at100
derived Reference duty at which the unit rate applies. Moving it without moving the rate re-prices every plant size.
Scale exponent0.97
projection Six-tenths-rule capacity factor: unit cost moves as (duty/ref)^(exponent-1). Held in the 0.88-0.97 band because Indian CBG equipment is modular rather than refinery-scale, and because the three sourced anchors themselves show only mild scale economy. A structural claim about how cost behaves, not a measured quantity.
DIALS ON THE CANVAS
Throughput4 t/dayrange 0.5 – 2,000Fresh tonnes delivered to the plant each day
Delivered price700 ₹/trange 0 – 1,750Catalogue reference is ₹700/t delivered. Gate price moves with belt, season and haulage.
Molasses
molasses
Industrialyear-roundassumed
Sugar refining residual syrup. Very high BMP and digestibility.
SOURCE — TAKES NOTHING · MAKES FEEDSTOCK
Total solids
80%
Methane potential (BMP)
380 Nm³/t VS
Volatile solids per fresh tonne
680 kg
All 14 figures and 2 dials
Sugar refining syrup used as a high yield accelerator stream.
WHAT IT IS MADE OF
Total solids80%
needs a citation Cite molasses BMP (commonly 350-400 Nm3/t-VS)
Volatile solids, of total solids85%
needs a citation Cite molasses BMP (commonly 350-400 Nm3/t-VS)
C:N ratio18 : 1
needs a citation Cite molasses BMP (commonly 350-400 Nm3/t-VS)
WHAT IT TURNS INTO
Methane potential (BMP)380 Nm³/t VS
needs a citation Cite molasses BMP (commonly 350-400 Nm3/t-VS)
Methane fraction of raw biogas60%
needs a citation Cite molasses BMP (commonly 350-400 Nm3/t-VS)
Hydrolysis rate constant0.5 /day0.3 – 0.8
projection Soluble sugars. Hydrolysis is not the rate-limiting step at all here — the band is wide upward because for this substrate the model's assumption stops mattering rather than becoming more precise. Literature range for this substrate class. First-order hydrolysis constants for anaerobic digestion are conventionally reported in the 0.02-0.7 /d band, clustering by class: soluble sugars fastest, untreated lignocellulose slowest, manures and mixed organics between. Reviews of particulate hydrolysis kinetics (Vavilin and co-workers) and the ADM1 model report (Batstone and co-workers, IWA STR 13) are the basis for the bands.
PER FRESH TONNE
Volatile solids per fresh tonne680 kg
derived Total solids × volatile fraction. The plant is sized off this, not off the tonnage on the weighbridge.
Ultimate methane per fresh tonne258 Nm³ CH₄
derived BMP at infinite retention. A real reactor reaches a fraction of it, set by the hydrolysis constant above and the retention time of the digester it feeds.
WHAT IT COSTS
Reference delivered price₹3,500/t
projection National reference, not a quote. Delivered price is a per-project number and the node dial overrides it.
Palette default throughput2 t/day
assumed Palette default only. Never a modelling input once the author sets tonnage.
CARBON
Upstream carbon intensity1 gCO₂e/MJ
derived Ported from the config engine's four feedstock buckets. Replaced by per-feedstock sourced figures at stage 6.
WHAT IT ADDS TO CAPEX
Unit rate, per tonnes a day delivered1,50,000
projection Reception, weighbridge, storage pad and bunker on delivered tonnage. Apportionment of published project costs, not a quoted price — never present as one.
Reference duty the rate applies at100
derived Reference duty at which the unit rate applies. Moving it without moving the rate re-prices every plant size.
Scale exponent0.97
projection Six-tenths-rule capacity factor: unit cost moves as (duty/ref)^(exponent-1). Held in the 0.88-0.97 band because Indian CBG equipment is modular rather than refinery-scale, and because the three sourced anchors themselves show only mild scale economy. A structural claim about how cost behaves, not a measured quantity.
DIALS ON THE CANVAS
Throughput2 t/dayrange 0.5 – 2,000Fresh tonnes delivered to the plant each day
Delivered price3,500 ₹/trange 0 – 8,750Catalogue reference is ₹3,500/t delivered. Gate price moves with belt, season and haulage.
Paddy straw
paddy_straw
Agri-residueseasonalassumed
Rice harvest residue. Very high TS, wide C:N, slow to digest.
projection Untreated lignocellulose, high lignin. The slowest thing in the catalogue and a factor of four across the band, which is an honest statement about untreated straw. Pretreatment would move this and the engine claims no such uplift (law 3). Literature range for this substrate class. First-order hydrolysis constants for anaerobic digestion are conventionally reported in the 0.02-0.7 /d band, clustering by class: soluble sugars fastest, untreated lignocellulose slowest, manures and mixed organics between. Reviews of particulate hydrolysis kinetics (Vavilin and co-workers) and the ADM1 model report (Batstone and co-workers, IWA STR 13) are the basis for the bands.
PER FRESH TONNE
Volatile solids per fresh tonne680 kg
derived Total solids × volatile fraction. The plant is sized off this, not off the tonnage on the weighbridge.
Ultimate methane per fresh tonne163 Nm³ CH₄
derived BMP at infinite retention. A real reactor reaches a fraction of it, set by the hydrolysis constant above and the retention time of the digester it feeds.
WHAT IT COSTS
Reference delivered price₹1,200/t
projection National reference, not a quote. Delivered price is a per-project number and the node dial overrides it.
Palette default throughput2 t/day
assumed Palette default only. Never a modelling input once the author sets tonnage.
CARBON
Upstream carbon intensity2 gCO₂e/MJ
derived Ported from the config engine's four feedstock buckets. Replaced by per-feedstock sourced figures at stage 6.
WHAT IT ADDS TO CAPEX
Unit rate, per tonnes a day delivered1,50,000
projection Reception, weighbridge, storage pad and bunker on delivered tonnage. Apportionment of published project costs, not a quoted price — never present as one.
Reference duty the rate applies at100
derived Reference duty at which the unit rate applies. Moving it without moving the rate re-prices every plant size.
Scale exponent0.97
projection Six-tenths-rule capacity factor: unit cost moves as (duty/ref)^(exponent-1). Held in the 0.88-0.97 band because Indian CBG equipment is modular rather than refinery-scale, and because the three sourced anchors themselves show only mild scale economy. A structural claim about how cost behaves, not a measured quantity.
DIALS ON THE CANVAS
Throughput2 t/dayrange 0.5 – 2,000Fresh tonnes delivered to the plant each day
Delivered price1,200 ₹/trange 0 – 3,000Catalogue reference is ₹1,200/t delivered. Gate price moves with belt, season and haulage.
Cane trash
cane_trash
Agri-residueseasonalassumed
Sugarcane leaves and tops left in the field after harvest.
Sugarcane tops and dry leaves baled after the crushing season.
WHAT IT IS MADE OF
Total solids70%
needs a citation Cite cane trash characterisation (VSI / SBI)
Volatile solids, of total solids85%
needs a citation Cite cane trash characterisation (VSI / SBI)
C:N ratio60 : 1
needs a citation Cite cane trash characterisation (VSI / SBI)
WHAT IT TURNS INTO
Methane potential (BMP)220 Nm³/t VS
needs a citation Cite cane trash characterisation (VSI / SBI)
Methane fraction of raw biogas53%
needs a citation Cite cane trash characterisation (VSI / SBI)
Hydrolysis rate constant0.05 /day0.02 – 0.09
projection Untreated lignocellulose, comparable to straw and marginally more accessible. Literature range for this substrate class. First-order hydrolysis constants for anaerobic digestion are conventionally reported in the 0.02-0.7 /d band, clustering by class: soluble sugars fastest, untreated lignocellulose slowest, manures and mixed organics between. Reviews of particulate hydrolysis kinetics (Vavilin and co-workers) and the ADM1 model report (Batstone and co-workers, IWA STR 13) are the basis for the bands.
PER FRESH TONNE
Volatile solids per fresh tonne595 kg
derived Total solids × volatile fraction. The plant is sized off this, not off the tonnage on the weighbridge.
Ultimate methane per fresh tonne131 Nm³ CH₄
derived BMP at infinite retention. A real reactor reaches a fraction of it, set by the hydrolysis constant above and the retention time of the digester it feeds.
WHAT IT COSTS
Reference delivered price₹900/t
projection National reference, not a quote. Delivered price is a per-project number and the node dial overrides it.
Palette default throughput2 t/day
assumed Palette default only. Never a modelling input once the author sets tonnage.
CARBON
Upstream carbon intensity2 gCO₂e/MJ
derived Ported from the config engine's four feedstock buckets. Replaced by per-feedstock sourced figures at stage 6.
WHAT IT ADDS TO CAPEX
Unit rate, per tonnes a day delivered1,50,000
projection Reception, weighbridge, storage pad and bunker on delivered tonnage. Apportionment of published project costs, not a quoted price — never present as one.
Reference duty the rate applies at100
derived Reference duty at which the unit rate applies. Moving it without moving the rate re-prices every plant size.
Scale exponent0.97
projection Six-tenths-rule capacity factor: unit cost moves as (duty/ref)^(exponent-1). Held in the 0.88-0.97 band because Indian CBG equipment is modular rather than refinery-scale, and because the three sourced anchors themselves show only mild scale economy. A structural claim about how cost behaves, not a measured quantity.
DIALS ON THE CANVAS
Throughput2 t/dayrange 0.5 – 2,000Fresh tonnes delivered to the plant each day
Delivered price900 ₹/trange 0 – 2,250Catalogue reference is ₹900/t delivered. Gate price moves with belt, season and haulage.
Cattle manure
cattle_manure
Wasteyear-roundassumed
Dairy or beef cattle slurry. Low TS, low C:N, abundant near dairies.
SOURCE — TAKES NOTHING · MAKES FEEDSTOCK
Total solids
12%
Methane potential (BMP)
200 Nm³/t VS
Volatile solids per fresh tonne
96 kg
All 15 figures and 2 dials
Fresh slurry collected at dairies and feedlots within the catchment.
WHAT IT IS MADE OF
Total solids12%
needs a citation Cite Indian dairy manure BMP (NDDB / IGFRI)
Volatile solids, of total solids80%
needs a citation Cite Indian dairy manure BMP (NDDB / IGFRI)
C:N ratio18 : 1
needs a citation Cite Indian dairy manure BMP (NDDB / IGFRI)
WHAT IT TURNS INTO
Methane potential (BMP)200 Nm³/t VS
needs a citation Cite Indian dairy manure BMP (NDDB / IGFRI)
Methane fraction of raw biogas55%
needs a citation Cite Indian dairy manure BMP (NDDB / IGFRI)
Hydrolysis rate constant0.13 /day0.08 – 0.2
projection Ruminant manure is the best-characterised substrate in this table; roughly 0.13 /d is the figure most commonly reported for mesophilic cattle slurry. Literature range for this substrate class. First-order hydrolysis constants for anaerobic digestion are conventionally reported in the 0.02-0.7 /d band, clustering by class: soluble sugars fastest, untreated lignocellulose slowest, manures and mixed organics between. Reviews of particulate hydrolysis kinetics (Vavilin and co-workers) and the ADM1 model report (Batstone and co-workers, IWA STR 13) are the basis for the bands.
PER FRESH TONNE
Volatile solids per fresh tonne96 kg
derived Total solids × volatile fraction. The plant is sized off this, not off the tonnage on the weighbridge.
Ultimate methane per fresh tonne19.2 Nm³ CH₄
derived BMP at infinite retention. A real reactor reaches a fraction of it, set by the hydrolysis constant above and the retention time of the digester it feeds.
WHAT IT COSTS
Reference delivered price₹300/t
projection National reference, not a quote. Delivered price is a per-project number and the node dial overrides it.
Palette default throughput5 t/day
assumed Palette default only. Never a modelling input once the author sets tonnage.
CARBON
Upstream carbon intensity6 gCO₂e/MJ
derived Ported from the config engine's four feedstock buckets. Replaced by per-feedstock sourced figures at stage 6.
Avoided manure methane credit-15 gCO₂e/MJ
projection Manure that would otherwise have emitted methane from an open lagoon.
WHAT IT ADDS TO CAPEX
Unit rate, per tonnes a day delivered1,50,000
projection Reception, weighbridge, storage pad and bunker on delivered tonnage. Apportionment of published project costs, not a quoted price — never present as one.
Reference duty the rate applies at100
derived Reference duty at which the unit rate applies. Moving it without moving the rate re-prices every plant size.
Scale exponent0.97
projection Six-tenths-rule capacity factor: unit cost moves as (duty/ref)^(exponent-1). Held in the 0.88-0.97 band because Indian CBG equipment is modular rather than refinery-scale, and because the three sourced anchors themselves show only mild scale economy. A structural claim about how cost behaves, not a measured quantity.
DIALS ON THE CANVAS
Throughput5 t/dayrange 0.5 – 2,000Fresh tonnes delivered to the plant each day
Delivered price300 ₹/trange 0 – 750Catalogue reference is ₹300/t delivered. Gate price moves with belt, season and haulage.
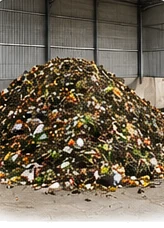
MSW organic fraction
msw_organic
Wasteyear-roundassumed
Wet biodegradable fraction of municipal solid waste. Tipping fee eligible.
projection Organic fraction of municipal solid waste. The band is wide because the substrate is: composition varies with collection, season and how well segregation actually works. Literature range for this substrate class. First-order hydrolysis constants for anaerobic digestion are conventionally reported in the 0.02-0.7 /d band, clustering by class: soluble sugars fastest, untreated lignocellulose slowest, manures and mixed organics between. Reviews of particulate hydrolysis kinetics (Vavilin and co-workers) and the ADM1 model report (Batstone and co-workers, IWA STR 13) are the basis for the bands.
PER FRESH TONNE
Volatile solids per fresh tonne225 kg
derived Total solids × volatile fraction. The plant is sized off this, not off the tonnage on the weighbridge.
Ultimate methane per fresh tonne67.5 Nm³ CH₄
derived BMP at infinite retention. A real reactor reaches a fraction of it, set by the hydrolysis constant above and the retention time of the digester it feeds.
WHAT IT COSTS
Reference delivered price₹100/t
projection National reference, not a quote. Delivered price is a per-project number and the node dial overrides it.
Palette default throughput5 t/day
assumed Palette default only. Never a modelling input once the author sets tonnage.
CARBON
Upstream carbon intensity1 gCO₂e/MJ
derived Ported from the config engine's four feedstock buckets. Replaced by per-feedstock sourced figures at stage 6.
Avoided landfill credit-25 gCO₂e/MJ
projection Organic fraction diverted from a landfill that would have emitted it.
WHAT IT ADDS TO CAPEX
Unit rate, per tonnes a day delivered1,50,000
projection Reception, weighbridge, storage pad and bunker on delivered tonnage. Apportionment of published project costs, not a quoted price — never present as one.
Reference duty the rate applies at100
derived Reference duty at which the unit rate applies. Moving it without moving the rate re-prices every plant size.
Scale exponent0.97
projection Six-tenths-rule capacity factor: unit cost moves as (duty/ref)^(exponent-1). Held in the 0.88-0.97 band because Indian CBG equipment is modular rather than refinery-scale, and because the three sourced anchors themselves show only mild scale economy. A structural claim about how cost behaves, not a measured quantity.
DIALS ON THE CANVAS
Throughput5 t/dayrange 0.5 – 2,000Fresh tonnes delivered to the plant each day
Delivered price100 ₹/trange 0 – 500Catalogue reference is ₹100/t delivered. Gate price moves with belt, season and haulage.
Process
What happens between the truck and the tanker: preparation, digestion, upgrading, compression.
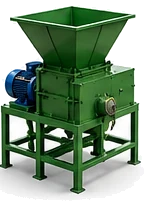
Shredder
shredder
projection
Chops green and soft wet material to a feedable particle size. Enough for napier, trash and segregated wet waste.
needs a citation Cite shredder specific energy for green biomass (4-8 kWh/t typical)
Handling cost₹120/t
projection Handling cost per tonne through the machine.
Tariff its power is charged at₹6/kWh
projection Indicative industrial tariff. State-specific, and one of the first inputs a developer should replace with their own.
WHAT IT ADDS TO CAPEX
Unit rate, per tonnes a day through the machine40,000
projection Prep machine base rate before the specific-energy term. Apportionment of published project costs, not a quoted price — never present as one.
Reference duty the rate applies at100
derived Reference duty at which the unit rate applies. Moving it without moving the rate re-prices every plant size.
Scale exponent0.95
projection Six-tenths-rule capacity factor: unit cost moves as (duty/ref)^(exponent-1). Held in the 0.88-0.97 band because Indian CBG equipment is modular rather than refinery-scale, and because the three sourced anchors themselves show only mild scale economy. A structural claim about how cost behaves, not a measured quantity.
Uplift per kWh/t of specific energy12,000
projection Added to the prep base rate per kWh/t of specific energy. Apportionment of published project costs, not a quoted price — never present as one.
DIALS ON THE CANVAS
Handling cost120 ₹/trange 0 – 600Power, wear parts and labour to put a tonne through this machine
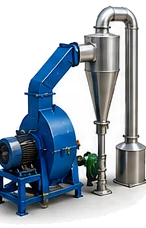
Hammer mill
hammer_mill
projection
Impact milling for dry lignocellulosic straw. Baled paddy straw cannot be wetted out or pumped until it has been through one.
needs a citation Cite hammer mill specific energy for cereal straw (20-40 kWh/t typical)
Handling cost₹250/t
projection Handling cost per tonne through the machine.
Tariff its power is charged at₹6/kWh
projection Indicative industrial tariff. State-specific, and one of the first inputs a developer should replace with their own.
WHAT IT ADDS TO CAPEX
Unit rate, per tonnes a day through the machine40,000
projection Prep machine base rate before the specific-energy term. Apportionment of published project costs, not a quoted price — never present as one.
Reference duty the rate applies at100
derived Reference duty at which the unit rate applies. Moving it without moving the rate re-prices every plant size.
Scale exponent0.95
projection Six-tenths-rule capacity factor: unit cost moves as (duty/ref)^(exponent-1). Held in the 0.88-0.97 band because Indian CBG equipment is modular rather than refinery-scale, and because the three sourced anchors themselves show only mild scale economy. A structural claim about how cost behaves, not a measured quantity.
Uplift per kWh/t of specific energy12,000
projection Added to the prep base rate per kWh/t of specific energy. Apportionment of published project costs, not a quoted price — never present as one.
DIALS ON THE CANVAS
Handling cost250 ₹/trange 0 – 600Power, wear parts and labour to put a tonne through this machine
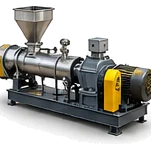
Extruder
extruder
projection
Mechanical pretreatment that shears lignocellulose open. Optional, energy hungry, and its yield uplift is not modelled here.
needs a citation Extruder BMP uplift is real but uncited here - cost only, no yield claim
Handling cost₹400/t
projection Handling cost per tonne through the machine.
Tariff its power is charged at₹6/kWh
projection Indicative industrial tariff. State-specific, and one of the first inputs a developer should replace with their own.
WHAT IT ADDS TO CAPEX
Unit rate, per tonnes a day through the machine40,000
projection Prep machine base rate before the specific-energy term. Apportionment of published project costs, not a quoted price — never present as one.
Reference duty the rate applies at100
derived Reference duty at which the unit rate applies. Moving it without moving the rate re-prices every plant size.
Scale exponent0.95
projection Six-tenths-rule capacity factor: unit cost moves as (duty/ref)^(exponent-1). Held in the 0.88-0.97 band because Indian CBG equipment is modular rather than refinery-scale, and because the three sourced anchors themselves show only mild scale economy. A structural claim about how cost behaves, not a measured quantity.
Uplift per kWh/t of specific energy12,000
projection Added to the prep base rate per kWh/t of specific energy. Apportionment of published project costs, not a quoted price — never present as one.
DIALS ON THE CANVAS
Handling cost400 ₹/trange 0 – 600Power, wear parts and labour to put a tonne through this machine
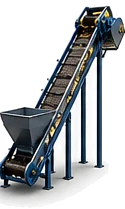
Conveying system
conveyor
projection
Belts, augers and a feed hopper. Bulk solids do not move themselves, and at plant scale this is a real line item.
projection Handling cost per tonne through the machine.
Tariff its power is charged at₹6/kWh
projection Indicative industrial tariff. State-specific, and one of the first inputs a developer should replace with their own.
WHAT IT ADDS TO CAPEX
Unit rate, per tonnes a day through the machine40,000
projection Prep machine base rate before the specific-energy term. Apportionment of published project costs, not a quoted price — never present as one.
Reference duty the rate applies at100
derived Reference duty at which the unit rate applies. Moving it without moving the rate re-prices every plant size.
Scale exponent0.95
projection Six-tenths-rule capacity factor: unit cost moves as (duty/ref)^(exponent-1). Held in the 0.88-0.97 band because Indian CBG equipment is modular rather than refinery-scale, and because the three sourced anchors themselves show only mild scale economy. A structural claim about how cost behaves, not a measured quantity.
Uplift per kWh/t of specific energy12,000
projection Added to the prep base rate per kWh/t of specific energy. Apportionment of published project costs, not a quoted price — never present as one.
DIALS ON THE CANVAS
Handling cost40 ₹/trange 0 – 600Power, wear parts and labour to put a tonne through this machine
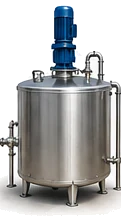
Mixing tank
mixer
assumed
Blends feedstocks, balances C:N, regulates flow into the digester.
TAKES FEEDSTOCK · MAKES SLURRY
Pre-heat temperature
30 °C
Unit rate, per tonnes a day mixed
60,000
All 4 figures and 1 dial
HOW IT RUNS
Pre-heat temperature30 °C
WHAT IT ADDS TO CAPEX
Unit rate, per tonnes a day mixed60,000
projection Blending and feed preparation on tonnes mixed. Apportionment of published project costs, not a quoted price — never present as one.
Reference duty the rate applies at100
derived Reference duty at which the unit rate applies. Moving it without moving the rate re-prices every plant size.
Scale exponent0.92
projection Six-tenths-rule capacity factor: unit cost moves as (duty/ref)^(exponent-1). Held in the 0.88-0.97 band because Indian CBG equipment is modular rather than refinery-scale, and because the three sourced anchors themselves show only mild scale economy. A structural claim about how cost behaves, not a measured quantity.
DIALS ON THE CANVAS
Pre-heat temperature30 °Crange 15 – 45Slurry temperature entering the digester
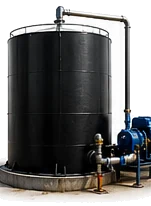
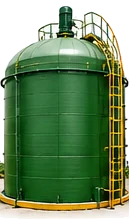
CSTR digester (mesophilic)
cstr_mesophilic
projection
Continuous stirred-tank reactor at ~35°C. Wants a pumpable wet slurry (TS ≤ 12%).
TAKES FEEDSTOCK OR SLURRY · MAKES RAW BIOGAS + DIGESTATE
Organic loading rate · warn above
4 kg VS/m³/day
Peak conversion temperature
35 °C
Unit rate, per cubic metres of active volume
14,000
All 10 figures and 2 dials
OPERATING ENVELOPE
Organic loading rate · warn above4 kg VS/m³/day
projection Workable above this, but with no headroom left for a feed swing.
Organic loading rate · refuse above5 kg VS/m³/day
projection Acidification risk above this loading.
Minimum retention time18 days
projection Below this the microbial population washes out.
Feed solids · maximum12
projection Above this the feed stops being pumpable, which is what a CSTR requires.
HOW IT CONVERTS
Peak conversion temperature35 °C
projection Optimum for the bell-curve derate. Mesophilic communities peak near 35C; dry plug-flow runs warmer.
Bell-curve width (σ)12 °C
projection Spread of the derate curve. Wider means the reactor tolerates more temperature swing.
Reactor modelContinuously stirred
derived Sets how retention time turns into gas. A plug-flow reactor gets more out of the same HRT than a fully mixed tank, because nothing short-circuits the outlet.
WHAT IT ADDS TO CAPEX
Unit rate, per cubic metres of active volume14,000
projection Tank, mixers, heating, gas holder, on active volume. Apportionment of published project costs, not a quoted price — never present as one.
Reference duty the rate applies at1,000
derived Reference duty at which the unit rate applies. Moving it without moving the rate re-prices every plant size.
Scale exponent0.93
projection Six-tenths-rule capacity factor: unit cost moves as (duty/ref)^(exponent-1). Held in the 0.88-0.97 band because Indian CBG equipment is modular rather than refinery-scale, and because the three sourced anchors themselves show only mild scale economy. A structural claim about how cost behaves, not a measured quantity.
Dry-fermentation plug-flow reactor at ~38°C. Designed for stackable, high-solids feed (TS ≥ 20%).
TAKES FEEDSTOCK OR SLURRY · MAKES RAW BIOGAS + DIGESTATE
Organic loading rate · warn above
6 kg VS/m³/day
Peak conversion temperature
38 °C
Unit rate, per cubic metres of active volume
14,000
All 10 figures and 2 dials
OPERATING ENVELOPE
Organic loading rate · warn above6 kg VS/m³/day
projection Workable above this, but with no headroom left for a feed swing.
Organic loading rate · refuse above8 kg VS/m³/day
projection Acidification risk above this loading.
Minimum retention time20 days
projection Below this the microbial population washes out.
Feed solids · minimum20
projection Below this the feed is too wet to stack and move through a dry reactor without channelling.
HOW IT CONVERTS
Peak conversion temperature38 °C
projection Optimum for the bell-curve derate. Mesophilic communities peak near 35C; dry plug-flow runs warmer.
Bell-curve width (σ)15 °C
projection Spread of the derate curve. Wider means the reactor tolerates more temperature swing.
Reactor modelPlug flow
derived Sets how retention time turns into gas. A plug-flow reactor gets more out of the same HRT than a fully mixed tank, because nothing short-circuits the outlet.
WHAT IT ADDS TO CAPEX
Unit rate, per cubic metres of active volume14,000
projection Tank, mixers, heating, gas holder, on active volume. Apportionment of published project costs, not a quoted price — never present as one.
Reference duty the rate applies at1,000
derived Reference duty at which the unit rate applies. Moving it without moving the rate re-prices every plant size.
Scale exponent0.93
projection Six-tenths-rule capacity factor: unit cost moves as (duty/ref)^(exponent-1). Held in the 0.88-0.97 band because Indian CBG equipment is modular rather than refinery-scale, and because the three sourced anchors themselves show only mild scale economy. A structural claim about how cost behaves, not a measured quantity.
Operating temperature38 °Crange 20 – 55Mesophilic plug-flow runs near 38°C with a broader tolerance.
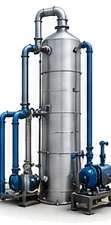
Water scrubber
scrubber
projection
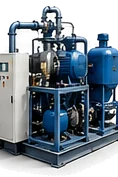
Pressurised water absorbs CO2, leaving CH4-rich gas at >95% purity.
TAKES RAW BIOGAS · MAKES RAW BIOGAS
Outlet methane purity
96
Unit rate, per Nm³/h of raw biogas
48,000
All 6 figures and 1 dial
WHAT COMES OUT
Outlet methane purity96
projection Methane purity the upgrading skid is specified to. IS 16087 requires at least 90%.
Methane recovered across the skid97%
projection Methane retained through upgrading. The 3% lost is vented in this model and is not yet counted as a fugitive emission — stage 6.
IS 16087 CBG specification95%
projection Methane fraction assumed when converting CBG mass to delivered energy.
WHAT IT ADDS TO CAPEX
Unit rate, per Nm³/h of raw biogas48,000
projection Upgrading skid on raw biogas throughput, Nm3/h. Apportionment of published project costs, not a quoted price — never present as one.
Reference duty the rate applies at500
derived Reference duty at which the unit rate applies. Moving it without moving the rate re-prices every plant size.
Scale exponent0.88
projection Six-tenths-rule capacity factor: unit cost moves as (duty/ref)^(exponent-1). Held in the 0.88-0.97 band because Indian CBG equipment is modular rather than refinery-scale, and because the three sourced anchors themselves show only mild scale economy. A structural claim about how cost behaves, not a measured quantity.
Compresses purified gas to 250 bar - the C in CBG.
TAKES RAW BIOGAS · MAKES CBG
Compression efficiency
98
Unit rate, per kg a day of CBG
6,500
All 6 figures and 1 dial
WHAT COMES OUT
Compression efficiency98
projection Mass retained through compression and dispensing. What is lost is venting and heel, not conversion.
Methane density at STP0.717 kg/Nm³
sourced Physical constant, methane density at STP
Lower heating value of methane35.8 MJ/kg
sourced Lower heating value of methane, 35.8 MJ/Nm3
WHAT IT ADDS TO CAPEX
Unit rate, per kg a day of CBG6,500
projection Compressor, cascade storage and dispensing on CBG capacity. Apportionment of published project costs, not a quoted price — never present as one.
Reference duty the rate applies at5,000
derived Reference duty at which the unit rate applies. Moving it without moving the rate re-prices every plant size.
Scale exponent0.92
projection Six-tenths-rule capacity factor: unit cost moves as (duty/ref)^(exponent-1). Held in the 0.88-0.97 band because Indian CBG equipment is modular rather than refinery-scale, and because the three sourced anchors themselves show only mild scale economy. A structural claim about how cost behaves, not a measured quantity.
DIALS ON THE CANVAS
Compression efficiency98 %range 90 – 99
Biochar pyrolysis
pyrolysis
projection
Slow-pyrolyses dried digestate solids into biochar at 450-600°C.
TAKES DIGESTATE · MAKES BIOCHAR
Biochar yield, dry basis
30
Unit rate, per kg a day of biochar
30,000
All 5 figures and 1 dial
WHAT COMES OUT
Biochar yield, dry basis30
projection Biochar mass per unit of dry digestate. Varies with pyrolysis temperature and residence time, neither of which is modelled yet.
Carbon credit on the char-20 gCO₂e/MJ
projection Biochar carbon held out of the atmosphere. A removal, never summed with avoidance.
WHAT IT ADDS TO CAPEX
Unit rate, per kg a day of biochar30,000
projection Pyrolysis reactor on biochar output. Apportionment of published project costs, not a quoted price — never present as one.
Reference duty the rate applies at500
derived Reference duty at which the unit rate applies. Moving it without moving the rate re-prices every plant size.
Scale exponent0.88
projection Six-tenths-rule capacity factor: unit cost moves as (duty/ref)^(exponent-1). Held in the 0.88-0.97 band because Indian CBG equipment is modular rather than refinery-scale, and because the three sourced anchors themselves show only mild scale economy. A structural claim about how cost behaves, not a measured quantity.
DIALS ON THE CANVAS
Biochar yield (dry basis)30 %range 15 – 45
Byproduct
The three things a CBG plant sells that are not gas.
Digestate -> FOM
fom
projection
Fermented organic manure. Stabilised digestate sold as soil amendment.
TAKES DIGESTATE · SINK — MAKES NOTHING
Digestate as a fraction of feed mass
22%19 – 25
Default sale price
₹3/kg2 – 4.5
Unit rate, per tonnes a day of digestate
2,00,000
All 7 figures and 1 dial
WHERE IT COMES FROM
Digestate as a fraction of feed mass22%19 – 25
derived SBPL FDPR Kalaburagi (Jul 2026), FDPR-05: 79.11 t/d saleable solid FOM from 340 t/d napier ≈ 19% of fresh feed after moisture reduction and sieve rejection
Moisture in the digestate30%
derived SBPL FDPR Kalaburagi (Jul 2026), FDPR-05: solid bio-slurry sold at <30% moisture
WHAT IT SELLS FOR
Default sale price₹3/kg2 – 4.5
derived SBPL FDPR Kalaburagi (Jul 2026), FDPR-05: ₹3/kg base for solid FOM, local market ₹3-5/kg; unified-calculator-spec: ₹3-4.5/kg bulk
Avoided fertiliser credit-3 gCO₂e/MJ
projection Digestate displacing synthetic fertiliser when recovered as FOM.
WHAT IT ADDS TO CAPEX
Unit rate, per tonnes a day of digestate2,00,000
projection Separation, drying yard and bagging on FOM tonnage. Apportionment of published project costs, not a quoted price — never present as one.
Reference duty the rate applies at50
derived Reference duty at which the unit rate applies. Moving it without moving the rate re-prices every plant size.
Scale exponent0.93
projection Six-tenths-rule capacity factor: unit cost moves as (duty/ref)^(exponent-1). Held in the 0.88-0.97 band because Indian CBG equipment is modular rather than refinery-scale, and because the three sourced anchors themselves show only mild scale economy. A structural claim about how cost behaves, not a measured quantity.
DIALS ON THE CANVAS
Sale price3 ₹/kgrange 1 – 8
Biochar
biochar
projection
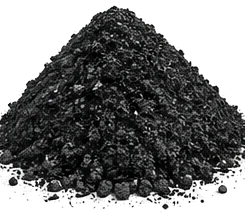
Stable carbon. Sold as soil amendment or carbon credit.
TAKES BIOCHAR · SINK — MAKES NOTHING
Default sale price
₹21/kg
All 2 figures and 1 dial
WHAT IT SELLS FOR
Default sale price₹21/kg
projection Indicative bulk price. FOM in particular is an estimate pending a digestate assay and a real offtake quote, and must not be presented as sourced until both exist.
Carbon credit on the char-20 gCO₂e/MJ
projection Biochar carbon held out of the atmosphere. A removal, never summed with avoidance.
DIALS ON THE CANVAS
Sale price21 ₹/kgrange 10 – 60
Food-grade CO2
co2tank
projection
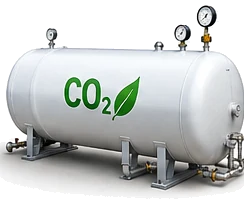
Polished CO2 sold to beverage, greenhouse, and food-processing markets.
TAKES RAW BIOGAS · MAKES CO₂
CO₂ recovered to food grade
85%
Default sale price
₹8/kg
Unit rate, per kg a day of CO₂
14,000
All 6 figures and 1 dial
WHERE IT COMES FROM
CO₂ recovered to food grade85%
CO₂ density at STP1.98 kg/Nm³
sourced Physical constant, carbon dioxide density at STP
WHAT IT SELLS FOR
Default sale price₹8/kg
projection Indicative bulk price. FOM in particular is an estimate pending a digestate assay and a real offtake quote, and must not be presented as sourced until both exist.
WHAT IT ADDS TO CAPEX
Unit rate, per kg a day of CO₂14,000
projection Liquefaction, purification to food grade, and storage. Apportionment of published project costs, not a quoted price — never present as one.
Reference duty the rate applies at2,000
derived Reference duty at which the unit rate applies. Moving it without moving the rate re-prices every plant size.
Scale exponent0.88
projection Six-tenths-rule capacity factor: unit cost moves as (duty/ref)^(exponent-1). Held in the 0.88-0.97 band because Indian CBG equipment is modular rather than refinery-scale, and because the three sourced anchors themselves show only mild scale economy. A structural claim about how cost behaves, not a measured quantity.
DIALS ON THE CANVAS
Sale price8 ₹/kgrange 4 – 25
Offtake
Who buys the gas, and what that route costs to build and to run.
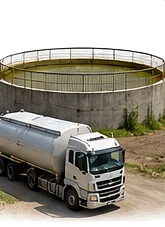
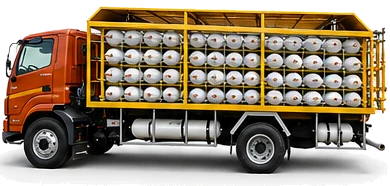
OMC tanker (SATAT)
omc
projection
Tanker pickup by an oil marketing company under the SATAT scheme.
TAKES CBG · SINK — MAKES NOTHING
Default gate price
₹105/kg72.9 – 110
Delivery emissions
2 gCO₂e/MJ
Tanker loading bay, lump sum
₹1,20,00,000
All 6 figures and 2 dials
WHAT IT PAYS
Default gate price₹105/kg72.9 – 110
pending verification Gate price is a scenario input, not a constant. The author's dial overrides it and the brief prints whichever was used. The p50 leans on the unverified ₹2,110/MMBtu administered floor; the band's low end (₹72.91-78.91/kg) is what a July 2026 bankable DPR actually banks on — stress any payback at that floor before believing it.
Transport to the buyer₹3/kg
projection Cost of reaching the buyer on this route. Distance-specific, and a real per-project input.
Notified CBG price basis₹105/kg72.9 – 110
pending verification Administered floor, GOBARdhan — National Circular Bioenergy Scheme, Union Cabinet 6 Aug 2026 (guaranteed minimum, 10 years)
CARBON
Delivery emissions2 gCO₂e/MJ
projection Tankered to an OMC retail outlet under SATAT.
WHAT IT ADDS TO CAPEX
Tanker loading bay, lump sum₹1,20,00,000
projection Loading bay only. The tanker fleet is the buyer's.
Calibration multiplier1.24
derived Global scale factor, set against the two internally consistent anchors (10 and 25 TPD) built at their own stated feed and reactor volume. Refitted from 1.199 when the FOM basis moved from wet digestate to saleable solid (31 Aug 2026): the smaller digestate-handling duty took ~3% off every plant, and this constant absorbs it back. Residuals after refit: ~-3.2% at 10 TPD, ~+3.1% at 25 TPD. The residual spread between the two anchors is set by the scale exponents, not by this constant, so ~3% is the best a single factor can do; narrowing it means refitting the exponents. The Kalaburagi FDPR cross-check in calibrate/anchors.ts sits ~10% above this build-up and is deliberately not fitted.
DIALS ON THE CANVAS
Gate price105 ₹/kgrange 50 – 160
Transport2.5 ₹/kgrange 0 – 8
CGD pipeline
cgd
projection
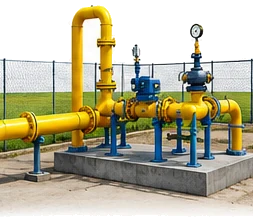
Direct injection into a city gas distribution pipeline.
TAKES CBG · SINK — MAKES NOTHING
Default gate price
₹110/kg75 – 115
Delivery emissions
0.5 gCO₂e/MJ
Grid injection point, lump sum
₹2,50,00,000
All 6 figures and 2 dials
WHAT IT PAYS
Default gate price₹110/kg75 – 115
pending verification Gate price is a scenario input, not a constant. The author's dial overrides it and the brief prints whichever was used. Carries the OMC route's uncertainty plus a small injection premium; the band low end tracks the bankable floor.
Transport to the buyer₹1/kg
projection Cost of reaching the buyer on this route. Distance-specific, and a real per-project input.
Notified CBG price basis₹105/kg72.9 – 110
pending verification Administered floor, GOBARdhan — National Circular Bioenergy Scheme, Union Cabinet 6 Aug 2026 (guaranteed minimum, 10 years)
CARBON
Delivery emissions0.5 gCO₂e/MJ
projection Injected into a city gas grid at the plant boundary.
derived Global scale factor, set against the two internally consistent anchors (10 and 25 TPD) built at their own stated feed and reactor volume. Refitted from 1.199 when the FOM basis moved from wet digestate to saleable solid (31 Aug 2026): the smaller digestate-handling duty took ~3% off every plant, and this constant absorbs it back. Residuals after refit: ~-3.2% at 10 TPD, ~+3.1% at 25 TPD. The residual spread between the two anchors is set by the scale exponents, not by this constant, so ~3% is the best a single factor can do; narrowing it means refitting the exponents. The Kalaburagi FDPR cross-check in calibrate/anchors.ts sits ~10% above this build-up and is deliberately not fitted.